
Completed Projects
Q: How accurately can Emergency Department (ED) admission be predicted for an individual patient at the time of triage, using routinely collected clinical and demographic information?

Approach: This project develops a machine learning model to estimate the probability that an ED patient will be admitted to the hospital at the time of presentation. Predictor variables include age, sex, body part injured, mechanism and severity of injury, and other routinely recorded triage fields. Two model families are used: logistic regression for interpretability and a random forest classifier for potentially higher predictive accuracy. Both models are trained and evaluated on 25 years of de‑identified ED encounter data.
Select Conclusions and Results:
Over the 25‑year period, approximately 9% of ED visits resulted in hospital admission, 89% were treated and released, and about 2% ended in patients leaving before treatment completion or being transferred to another facility.
Model‑estimated admission probabilities are highest for elderly patients, especially those with high‑severity injuries or certain high‑risk injury categories.
Over the past 15 years there has been a sustained increase in severe injuries among elderly patients across all injury categories, which is consistent with demographic shifts associated with the aging baby‑boomer population.
ED encounters during the Covid‑19 years (2020–2021) show a marked increase in admission rates. Because Covid‑19–related illness substantially altered ED processes, these years should therefore be analyzed separately or treated as outliers when estimating baseline admission patterns.
Hospital ED admission rates vary by patient age, sex, race, diagnosis, injury characteristics, and other clinical factors. High ED volumes and uncertain admission demand contribute to crowding, bed shortages, and delays in care, particularly in urban and teaching hospitals that often operate at or near capacity. A patient‑level predictive model of admission can help hospitals allocate resources more efficiently and prioritize high‑risk patients for early bed management and specialist consultation.
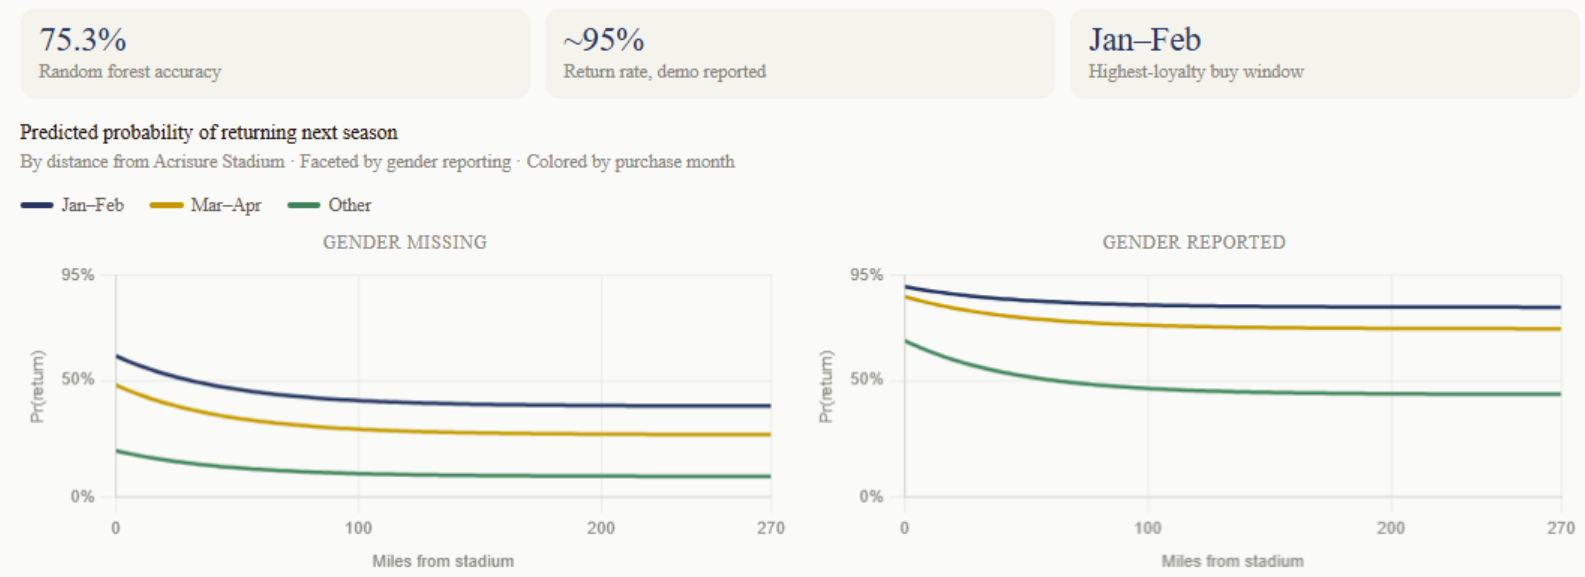
Q: How well can we predict which University of Pittsburgh football season-ticket holders will renew?
Season ticket retention is the financial backbone of college athletic programs, and it depends on who fans are, where they live, when they buy, and how they engage. Using logistic regression and a random forest classifier trained on Pitt Athletics ticketing and customer records, we modeled each account’s probability of renewing for the following season.
Results: The most important predictors include whether a fan reports age and gender (a proxy for engagement depth), the month of purchase (January–February buyers are the most likely to return), and distance from Acrisure Stadium. It was somewhat surprising to find that fans who report demographic information have an estimated 95% probability of renewing, controlling for other factors. Overall model performance was strong. (Lift curves indicated meaningful separation between likely and unlikely renewals.)
Recommended Action: Integrate the model into the ticketing CRM to flag at-risk accounts (low predicted renewal probability) for targeted outreach before the renewal window closes, and prioritize high-ROI segments for email, phone, or in-game engagement campaigns.
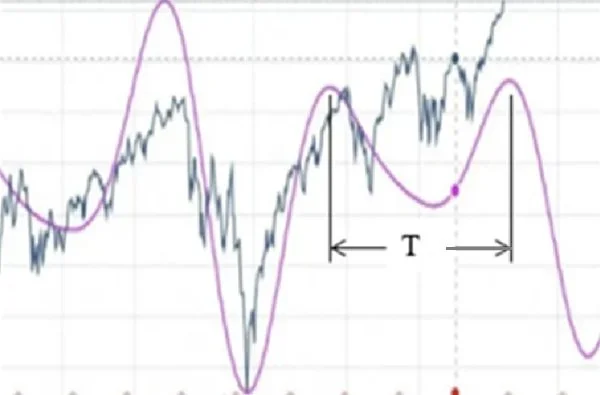
Q: How truly cyclical are cyclical stocks?
Certain groups of stocks (e.g., semiconductor, finance, energy) are commonly labeled cyclical, but what does that mean for projecting their future prices? If a stock exhibits approximately cyclical behavior, we hypothesize that its price can be modeled as a trend plus a sinusoidal component, i.e., a linear term plus a sinusoidal fit. Once fitted, we can estimate its oscillation period and amplitude, which in turn may help identify time windows where buying or selling is more favorable, subject to risk and model uncertainty. This approach differs from more conventional technical indicators that rely on moving averages and volatility bands based on standard deviations of prices. Our method combines linear regression with sinusoidal curve fitting to estimate a fundamental oscillation period, T, for each stock. In some cases, T is long enough that a full or partial cycle aligns with the holding period required for the U.S. long‑term capital gains tax treatment.
Action: We have modeled industrial and financial stocks and estimated their fundamental periods using daily price data from January 2023 through December 2024 (with the model currently projected forward to December 2026). Given current geopolitical volatility in the Middle East, we plan to delay entries and instead monitor out‑of‑sample performance of the model’s signals before committing capital. Please stand by for updates as we track and evaluate the model’s live performance.
Extensions: Beyond the potential trading applications, our long‑term goal is to use the extracted cycle features (e.g., estimated periods, amplitudes, and phase) as structured inputs to downstream deep learning models.
A caveat: “Markets can remain illogical longer than you can remain solvent.” – John Maynard Keynes.